
Every decision you make is already in your data.
What is turning, what is dead, who is worth chasing, where the pipeline leaks and which jobs actually pay. Live dashboards and more than 40 built-in reports, reading the same database your shop runs on.


What is Jewelia Analytics?
Reporting that reads the business, not a copy of it
Most jewelers are not short of data. It is in the till, the stock book, the repair envelope and three people’s memory, which is the same as not having it. Jewelia Analytics reads the same database that POS, inventory, production and memo write to, so the numbers are current rather than reconstructed at month end.
The report is built by hand at month end
What it costs youAn afternoon in a spreadsheet, and the numbers are three weeks stale by the time anyone reads them.
How Jewelia solves itForty-plus reports that read the live database: sales, stock, memo aging, production throughput, client value — current the moment you open them.See how
"How did bridal do vs last year?"
What it costs youNobody can answer without an export, a pivot table and an hour.
How Jewelia solves itAsk Jewelia AI in plain English and it answers from your live data — then sends you the same report every Monday if you want it.See how
Dead stock hides in the total
What it costs youThe inventory figure looks healthy. Inside it, 23 pieces have not moved in a year.
How Jewelia solves itAging by category and location, with the slow movers listed by cost, so a markdown decision is a list rather than a hunch.See how
The workshop is a black box
What it costs youYou know what a job sold for. You do not know what it cost in bench hours or which stage it waited in.
How Jewelia solves itStage timings, rework and cost per piece from the production board, reported rather than estimated.See how
One store's numbers, not the business's
What it costs youMulti-location means three sets of figures and a reconciliation.
How Jewelia solves itMulti-location analytics with stock and sales per store on one screen, on Enterprise.See how
Live, not month-end
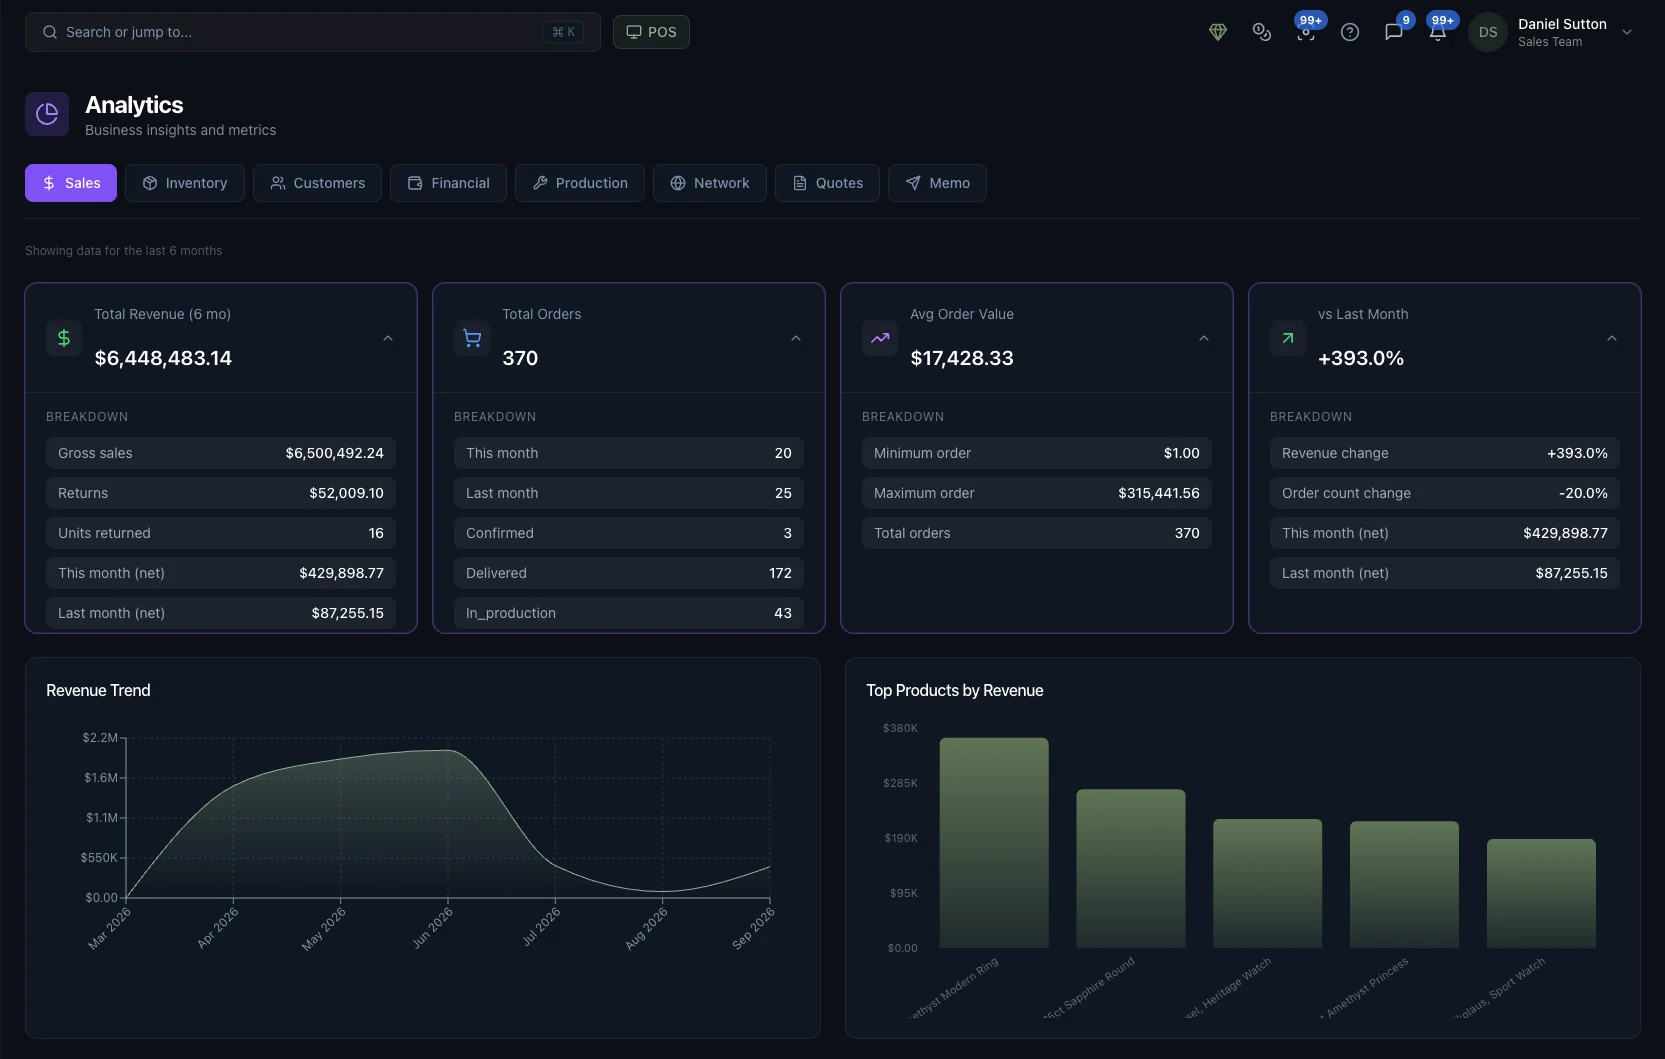
The dashboard reads the same database the shop runs on, so revenue, orders and average order value move as the day moves — not when somebody finishes a spreadsheet.
Over 40 reports, already written
Sales, inventory, customers, finance, production, pipeline, memo, purchasing and compliance. The questions a jewelry business asks every month are answered out of the box.
Then build your own
The custom report builder spans nine data sources, so the question nobody anticipated still gets an answer — saved, re-run and exported like any other report.
It leaves the building
Every report exports to CSV and Excel, and Enterprise adds API access so a BI tool or an accountant can pull the numbers directly.
Why the data matters
Six decisions that stop being guesses
A dashboard is only worth having if it changes what you do next. These are the six calls a jewelry business makes on instinct, and what the data says about each of them instead.
What to buy, and what to stop buying
Inventory value and turnover by category tell you which part of the case is working capital and which part is a display. Most jewelers discover that a surprising share of the floor has not moved in a year — and that the cash tied up in it would have covered the line that sells out every quarter.
Which customers are worth chasing
Customer lifetime value ranks by what people have actually spent over time rather than by who came in last week. It also surfaces the quiet ones: high-value buyers who have not been back, which is the cheapest list of leads a jewelry business owns.
Where the sales process leaks
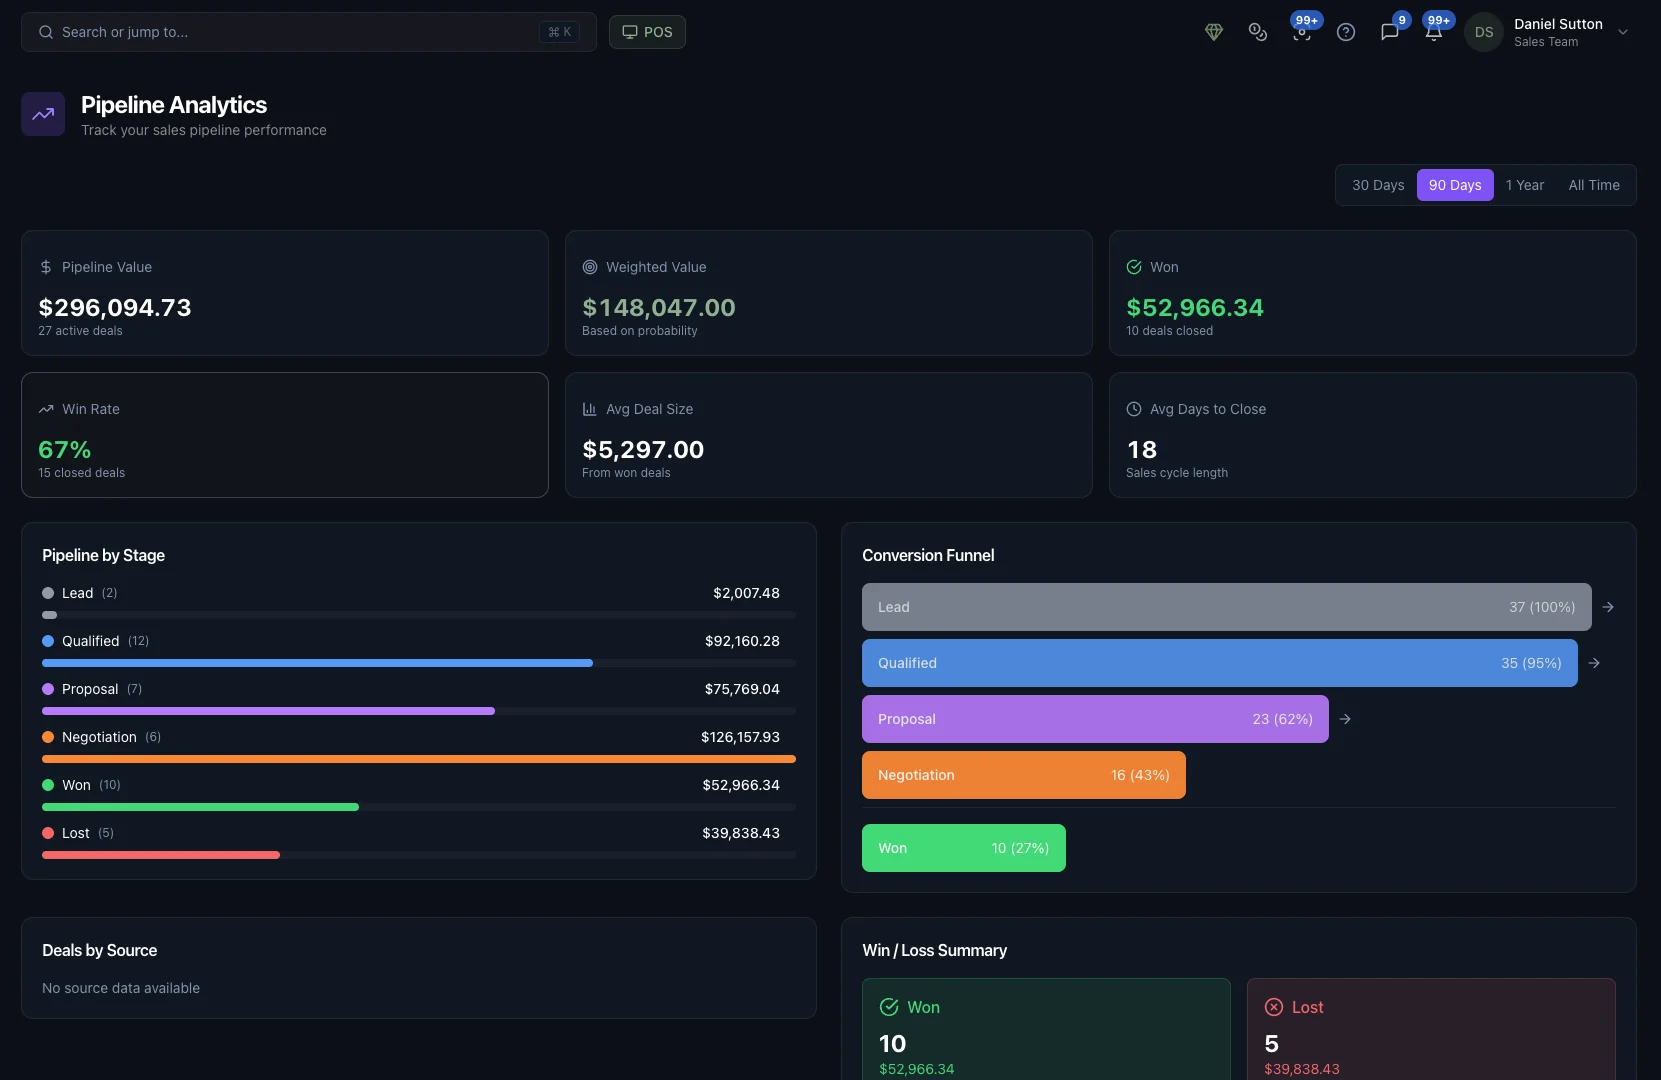
A conversion funnel that shows 95% surviving qualification and 43% reaching negotiation is telling you where to spend the training budget. Without it, the only available conclusion is “we need more leads”, which is usually both expensive and wrong.
Which jobs make money and which ones only look busy
Production throughput and stage timings, set against the value of the job, separate the work that pays from the work that merely fills the bench. Repairs in particular are easy to price from habit and hard to price from evidence.
What the memo position is really costing you
Value out on consignment, aged by counterparty, is stock you own sitting in someone else's case. Seen as a number rather than a list, it usually changes who gets the next parcel.
Which locations and which people are performing
Revenue and margin by rep and by location turn a general impression into a comparison. On Enterprise, multi-location reporting makes that comparison the default view rather than a manual exercise.
Seven dashboards
One business, seen seven ways
Jewelry store analytics is not one number. A wholesaler asks a different question of the same week than a retailer does, so the dashboard has a tab for each part of the business rather than one averaged view of all of it.
Sales
Revenue, order count, average order value and month-on-month movement, with gross sales, returns and units returned broken out underneath.
Inventory
What you own, what it is worth, what is turning and what has not moved — the difference between a stock list and an asset you are managing.
Customers
Lifetime value, who your best customers are and who has gone quiet, so retention work goes to the right names.
Financial
Margin, takings and the money view of the same activity the sales dashboard counts in units.
Production
Throughput, stage timings and where jobs are actually sitting — the operational picture behind a delivery date.
Quotes
What you quoted, what converted and what went quiet, so quoting stops being a black hole.
Memo
Value out on consignment, aging and overdue positions by counterparty.
Pipeline & forecasting
A forecast you can defend.
“We’ve got a good month coming” is not a forecast. Weighted pipeline, win rate, average deal size and real cycle length turn the same optimism into a number, and the conversion funnel shows which stage is quietly losing the deals.
- Pipeline value
- Everything open, in dollars, across active deals.
- Weighted value
- The same pipeline adjusted by probability — the number worth planning against.
- Win rate
- Closed-won as a share of closed deals, so the forecast has a factual basis.
- Average deal size
- From won deals, not from hopes, which is what makes it useful.
- Average days to close
- Your real sales cycle length, measured rather than estimated.
- Conversion funnel
- Lead to qualified to proposal to negotiation to won, with the count and percentage surviving each step — so you can see which stage is actually leaking.
The report library
Over 40 jewelry reports, already written
Not a blank report builder and good luck. The questions a jewelry business actually asks are answered out of the box — and the builder is there for the ones that are specific to you.
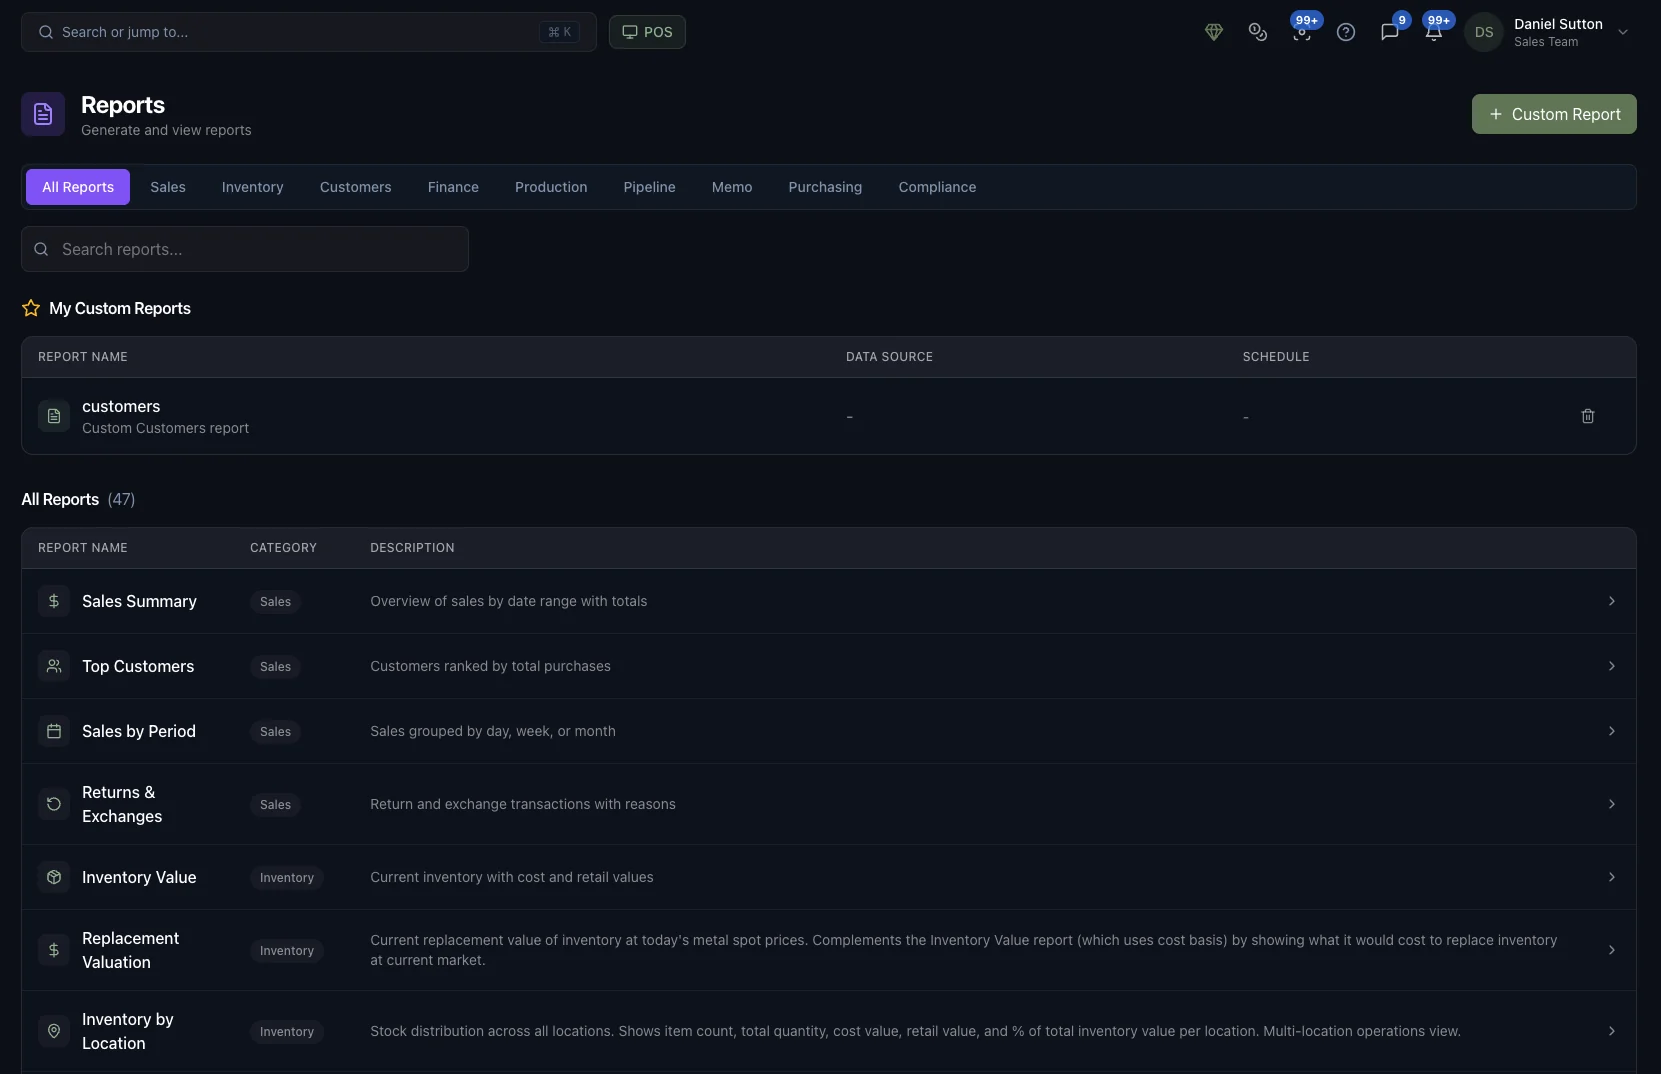
Sales Summary Sales
Sales by date range with totals.
Top Customers Sales
Customers ranked by total purchases.
Returns & Exchanges Sales
Return and exchange transactions with reasons.
Inventory Value Inventory
Current inventory at cost and retail value.
Replacement Valuation Inventory
What it would cost to replace your inventory at today's metal spot prices — the complement to a cost-basis valuation.
Inventory by Location Inventory
Item count, quantity, cost value, retail value and share of total inventory value per location.
- Plus pipeline and forecast, memo aging, customer lifetime value, sales by rep and location, purchasing and compliance — see the full library in the demo →
The data nobody else captures
Your bench is a data source.
Production jobs move through stages, and the bench records the work at each one rather than signing off at the end. That single habit turns the workshop from a black box into the most useful dataset in the business — because it is the only place where time, skill and rework are measured instead of assumed.
Most jewelry businesses can tell you what a job sold for. Very few can tell you what it cost them in bench hours, which stage it waited in, or whether it came back.
Read together with job value, this is how you price repairs from evidence, quote custom work without guessing, and find the constraint in your own workshop. See Production →
Time per stage
How long a job actually sat in casting, in setting, in QC — as recorded by the bench, not estimated afterwards from a delivery date.
Who did the work
Bench assignment per stage, so throughput and rework can be read by person rather than as one anonymous average for the workshop.
What went wrong
QC checklists with issue documentation and rework tracking, which is where the difference between a fast bench and a good one shows up.
Where jobs queue
Stage timings across many jobs expose the step that is the constraint — usually not the one everybody blames.
One database
Nothing is exported to be reported on
Analytics bolted onto a stack of separate systems reports on last night’s copy. Jewelia’s dashboards read the live records themselves, which is why a sale at the counter shows up in the numbers before the customer has left.
Point of Sale
Every ticket, trade-in and commission lands in the sales and financial dashboards as it is charged.
Inventory
Valuation, turnover and aging come from the stock records themselves rather than a periodic count.
Production & Repairs
Stage forms completed at the bench become throughput, timing and quality data.
Sales & CRM
Deals, stages and outcomes produce the pipeline, funnel and win/loss reporting.
Memo & Ledger
Consignment positions and balances feed aging by counterparty.
Jewelia AI
Ask a question in plain English instead of finding the report that answers it.
Or skip the report entirely and ask Jewelia AI a question about your own live data in plain English.
Jewelry analytics & reporting: questions
What is jewelry business analytics software?
Jewelry business analytics software turns the day-to-day records of a jewelry business — sales, inventory, customers, production jobs, memo positions and pipeline — into dashboards and reports you can act on. The distinction that matters is where the numbers come from: analytics built into the platform reads the live operating data, so inventory value, revenue and job throughput are current, while a separate BI tool reports on whatever was last exported into it. Jewelia includes live dashboards and more than 40 built-in reports, plus a custom report builder across nine data sources.
What reports does Jewelia include?
More than 40 built-in reports across nine categories — sales, inventory, customers, finance, production, pipeline, memo, purchasing and compliance. They include sales summary and sales by period, top customers, returns and exchanges, inventory value at cost and retail, replacement valuation at today's metal spot prices, inventory by location, pipeline and forecast, memo aging by counterparty and customer lifetime value. Every report has filters and exports to CSV and Excel.
Can I build my own reports?
Yes. The custom report builder spans nine data sources, so you can assemble the report your business actually needs, save it and re-run it. It is included on Professional and above. Starter includes 11 essential reports with the dashboard, Professional includes 29 plus the builder, and Enterprise includes all reports along with compliance and multi-location reporting.
Can I export data to Excel or a BI tool?
Yes. Every report exports to CSV and Excel, and Enterprise adds API access so Power BI, Tableau, Looker or your accountant's system can pull the data directly.
What data do I get from production?
Production jobs move through configurable stages, and the bench records the work at each one — which means time per stage, who the stage was assigned to, QC checklist outcomes, issues documented and rework tracked. Aggregated across jobs, that is the operational data most jewelry businesses have never had: where work actually queues, which stage causes rework, and how throughput differs between people and between job types.
Can I see performance by employee or by bench jeweler?
Yes, within the data the system captures. Sales reporting breaks revenue and margin down by rep, and because production stages are assigned to a person with time recorded per stage, throughput and rework can be read per bench jeweler rather than as a single workshop average. The point is usually less about ranking people than about finding where work is being handed off badly.
Does it report across multiple locations?
Yes. Inventory by location shows item count, quantity, cost value, retail value and each location's share of total inventory value, and multi-location performance reporting is included on Enterprise — so a group is compared as a group rather than by opening several spreadsheets side by side.
How is this different from running reports in QuickBooks?
Accounting software answers financial questions about money that has already moved. It cannot tell you inventory turnover by category, which stones have not sold in eighteen months, your weighted pipeline, memo aging by supplier, or how long a job sat in setting — because it never holds that data. Jewelia reports on the operations themselves, and the financial picture sits alongside rather than instead of it.
Is the data real time?
Yes. The dashboards read the same database that POS, inventory, production and memo write to, so a sale at the counter is reflected in the numbers immediately. There is no nightly sync, no warehouse load and no window in which the dashboard and the business disagree.
Can I just ask a question instead of finding a report?
Yes, on plans that include Jewelia AI. You can ask in plain English — which category is turning slowest, who has not bought in six months, what is overdue on memo — and get an answer from your own live data rather than hunting for the report that contains it.
Which plan includes analytics and reporting?
Every plan includes the live dashboard. Starter at $179/month includes 11 essential reports, Professional at $399/month includes 29 reports plus the custom report builder, and Enterprise includes all reports with compliance reporting, multi-location performance and API access.
See your own numbers, not a sample dataset.
30-day money-back guarantee. Cancel any month, no setup fees.